Monitor in Production
Watch latency, detection volume, and drift — and know when to retrain.
A deployed model is a fixed object in a moving world. Cameras get repositioned, lighting changes seasonally, new product variants appear. Without model monitoring you'll find out about the data drift when a customer complains. Platform shows you live latency, error rate, and traffic per endpoint; pair that with your own holdout validation — see the model monitoring & maintenance guide — and you'll spot regressions weeks earlier.
Use Platform's built-in dashboards to watch latency, error rate, and request volume — and stand up your own holdout/drift checks for accuracy regressions.
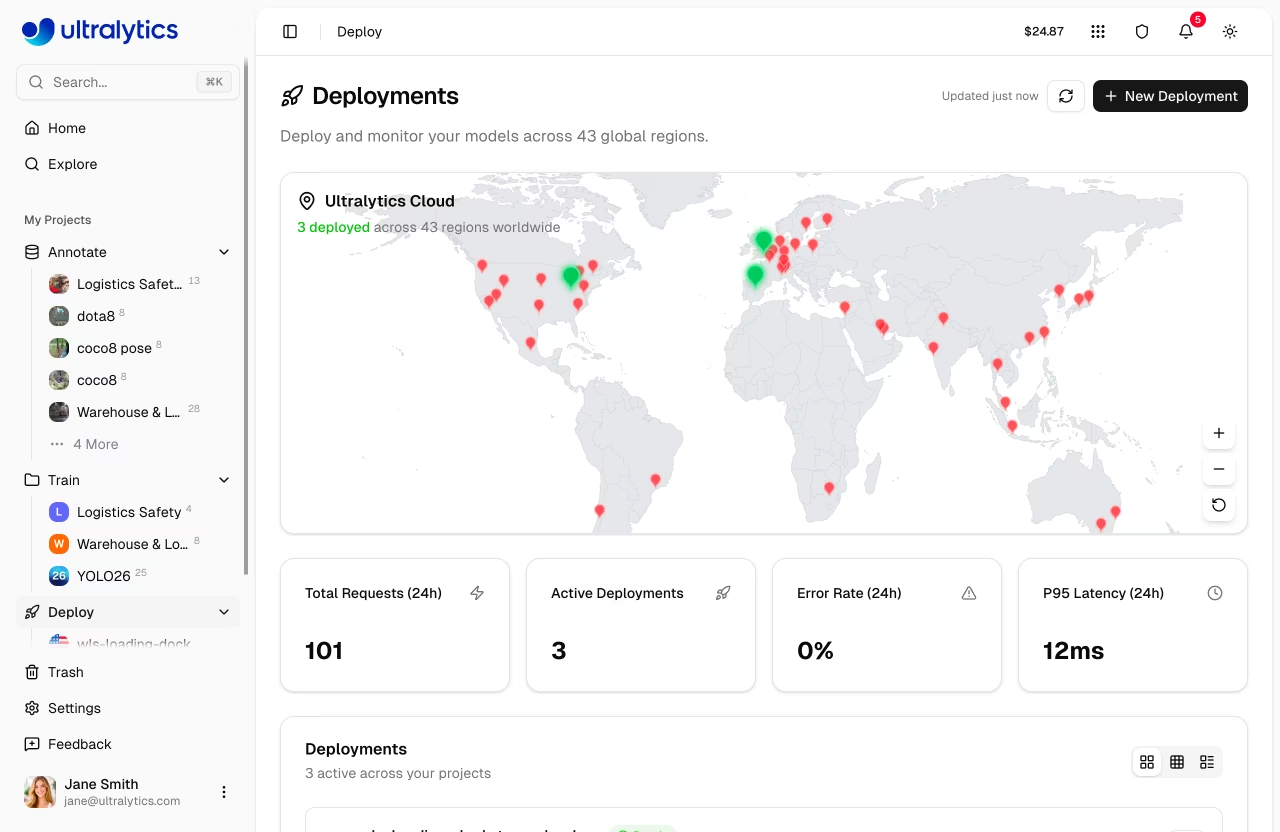
Watch the deployment card: p95 latency, error rate, request count (24h refreshes every 60s).
Card error rate goes red automatically when above 5% (24h average).
Sample 20–500 production frames into a holdout dataset for an off-Platform weekly mAP check.
Distribution drift — KS test on weekly confidence histograms — runs in your own job, not on Platform.
Hands-on
Link to this sectionWhat Platform monitoring covers out of the box#
Each endpoint card surfaces — refreshed every 60 seconds, polled every 15 seconds for status (3 seconds in transitional states):
| Metric | Window | What it catches |
|---|---|---|
| Request count | 24h | Traffic spikes or drops |
| P95 latency | 24h | Performance regressions |
| Error rate | 24h, red ≥ 5% | Auth, payload, infra issues |
| Health check | live, 20s retry on unhealthy | Endpoint availability |
| Logs | live (20 most recent in UI; API caps at 200) | Per-request severity, status, latency |
Aggregated metric ranges are 1h, 6h, 24h, 7d, or 30d via the /api/deployments/{id}/metrics endpoint. Metrics retain 30 days; logs retain 7. Platform also exposes a /health endpoint per deployment, which works with external uptime tools (Pingdom, UptimeRobot, Datadog).
Link to this sectionWhat Platform does not alert on#
Platform doesn't ship a per-deployment alerting product today — there's no UI for setting custom thresholds and routing pages. Treat the dashboards as your primary signal and wire alerting in your own observability stack:
- Pull metrics via the API on a cron (e.g. every 5 minutes) and forward to Datadog / Grafana / PagerDuty.
- Page on
P95 latency > budgetfor 3+ consecutive samples anderror rate > 1%for 5+ minutes. - Have on-call check the deployment's
Logstab (filter to Errors) before doing anything else.
Pair every alert with a one-line runbook entry — what does on-call do when this fires? — or it's noise.
Link to this sectionYour own holdout job#
The single most reliable production accuracy signal is a holdout you control. Platform doesn't run this for you, but it's a 30-line cron job:
- Reserve 200–500 production-realistic labeled images as a holdout (lesson 4); refresh the holdout each quarter.
- Run weekly
yolo valagainst your deployed model — locally or in CI — using the holdout dataset. - Push mAP@0.5:0.95 to your metric system; see the YOLO performance metrics guide for the math.
   mAP@0.5:0.95 over time
   0.62 │ ●●●●●●●●●●●●●
   0.60 │              ●●●●●●●
   0.58 │                     ●●  ← drift!
   0.56 │                       ●●●
        └──────────────────────────────▶  weeks
A clear downtrend over 3+ weeks is your early signal to investigate.
Link to this sectionDrift signals (off-Platform)#
Two cheap drift signals to compute yourself — log endpoint responses, then post-process weekly. Both are also useful for upstream anomaly detection:
- Confidence histogram — production model confidences for the current week. Compare to the histogram from deployment week. If it shifts left, the input domain has drifted.
- Object size distribution — width × height of detected boxes. Camera repositioning, lens changes, or a new deployment site usually show up here first.
A KS test gives a p-value:
   week 1   ▁▂▄█▇▄▁
   week 12  ▁▃▆█▆▂▁    KS statistic 0.04, p = 0.31    ← stable
   week 24  ▂▅█▇▃▁▁    KS statistic 0.18, p < 0.01    ← drifted
When the p-value crosses your threshold (commonly 0.01), promote the alert in your own observability stack and trigger the retraining loop below.
Link to this sectionWhen to retrain#
Drift signals don't always mean "retrain immediately." Common patterns:
| Pattern | Action |
|---|---|
| Confidence shift, mAP holding | Watch — could be benign domain shift the model handles |
| Confidence shift + mAP drop | Retrain. Real accuracy regression. |
| Detection volume drop, confidence stable | Investigate — might be a bug, a camera offline, or quieter scene |
| Latency regression | Hardware / infra investigation, not the model |
The retrain decision is also a data decision: what new data do you need? Sample drift-flagged frames into the labeling queue first.
Link to this sectionA retraining loop in practice#
Once you've done one retrain, codify it — this is the continual learning cycle in production form:
- Detect drift — alert fires.
- Sample drifted frames — pull recent production frames and upload them as a new dataset version.
- Auto-annotate + review — using the previous best model as the inference pass, ranked by active learning uncertainty.
- Retrain — fresh run from previous best.pt with lr0=0.001 (lesson 8).
- Validate against holdout + recent frames — both must improve.
- Deploy with rollout — gradual traffic shift; monitor for regression.
- Lock the new baseline — update the holdout with newly labeled frames over time.
The whole loop, on Platform, takes hours of engineer time and days of training/validation. Without Platform — and without a coherent MLOps story — it would take a sprint of glue work.
Set up two alerts on your deployment: one on p95 latency, one on detection volume drop. Synthetically trigger them — send malformed images to spike errors, or pause traffic to drop detection volume. Confirm the alert fires.
Your deployment has at least two configured alerts.
You have a weekly holdout validation job running.
You can name your retraining trigger — what signal would cause you to retrain.
Last two lessons: regions/compliance, and the operational shape of a long-running CV project.