Validate and Diagnose
Beyond the single mAP number — per-class AP, confusion matrices, and what they tell you to do next.
Training spit out a mAP number. That number is the start of the conversation, not the end. The interesting work is figuring out which class is dragging the metric down, what it's getting confused with, and what specific data would help. We'll run validation, read the artifacts, and make a list — the performance metrics guide is the long-form companion to this lesson.
Run validation, identify the bottleneck class, and write a 3-item list of dataset/model changes for the next training round.
yolo val model=runs/detect/.../weights/best.pt data=my_dataset/data.yaml.Open
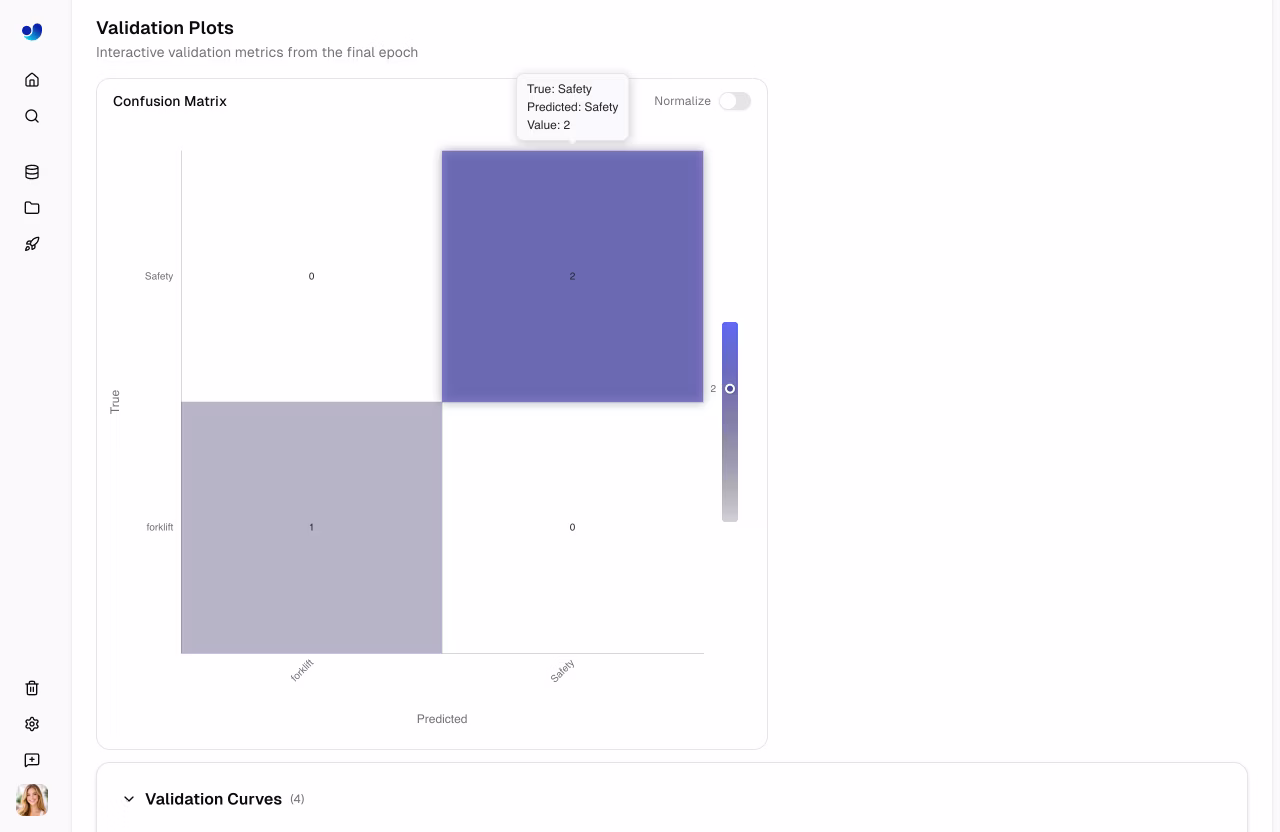
confusion_matrix_normalized.png— find the off-diagonal hotspots.Open
results.png— confirm training/val curves haven't diverged (overfit).Look at the worst-class PR curve — find the threshold where it drops off.
Hands-on
Link to this sectionRun validation#
yolo val model=runs/detect/forklift_v1/weights/best.pt data=my_dataset/data.yamlThat re-runs the val set and writes new artifacts to runs/detect/val/. The most useful files:
| File | What it tells you |
|---|---|
confusion_matrix.png / confusion_matrix_normalized.png | Where the model is confusing classes |
PR_curve.png | Per-class precision / recall curves |
F1_curve.png | F1 vs confidence threshold |
results.png | Loss / metric curves over training (in the train dir) |
val_batch0_labels.jpg / val_batch0_pred.jpg | Visual: true labels vs predictions on a batch |
Link to this sectionRead the confusion matrix first#
The confusion matrix is the single most useful diagnostic. It's a square plot, classes on both axes, with the diagonal showing correct predictions and the off-diagonal showing confusion.
              predicted
              forklift  person  pallet  background
ground   ┌─────────────────────────────────────────┐
forklift │   0.78      0.04    0.10      0.08
truth    │
person   │   0.03      0.91    0.00      0.06
pallet   │   0.18      0.00    0.65      0.17
back-    │   0.04      0.07    0.05      0.84
ground   └─────────────────────────────────────────┘
Reading this:
forklift → palletcell is 0.10 — 10% of forklift instances are predicted as pallet. Class confusion.pallet → backgroundcell is 0.17 — 17% of pallets are missed entirely. Recall problem.background → forkliftis 0.04 — small number of false positives where the model sees a forklift in empty space.
The fix list writes itself:
- Add hard examples that disambiguate forklift from pallet (forklifts visible behind pallets, partial forklifts, pallets close to forklifts).
- Add more pallet examples — 17% missed is too high.
- Background hard negatives — empty corridors that look like
forkliftcluttered backgrounds.
Link to this sectionRead the per-class AP#
Per-class AP from the val log:
                 Class   Images   Instances     Box(P    R    mAP50    mAP50-95)
                   all      50         102      0.78  0.71    0.74        0.51
              forklift      30          45      0.85  0.78    0.81        0.58
                person      40          50      0.92  0.88    0.91        0.64
                pallet      20           7      0.58  0.48    0.51        0.31
pallet is way below the others — and it has only 7 instances in val. Either the model is bad at pallets or you don't have enough val data to tell. Both fixes lead to "collect more pallets."
Link to this sectionAre you overfit?#
Open results.png. The training and validation data loss curves should track each other roughly. If training loss keeps falling while validation loss starts climbing, you've overfit — the model is memorizing. The opposite failure — both curves stuck high — is underfitting, and the bias-variance tradeoff is the lens for both.
Mitigations:
- Reduce
epochs(thepatiencearg auto-stops training when val mAP plateaus, which usually catches this). - Add data augmentation —
hsv_h,hsv_s,hsv_v,degrees,translate,scale,fliplr,mosaic. Ultralytics YOLO defaults are aggressive; tone them down only if you have a reason. - More data — almost always the right answer.
Link to this sectionVisual sanity check#
Compare val_batch0_labels.jpg and val_batch0_pred.jpg side by side. The differences are your failures, in concrete pictures. Patterns in those pictures (consistent missing class, consistent wrong region) are dataset stories — and dataset stories beat hyperparameter tuning every time.
Run yolo val on your trained model and open the confusion matrix. Pick the largest off-diagonal cell and write a one-line dataset improvement that would address it. Do the same for the worst per-class AP.
You've named the bottleneck class for your project from the val artifacts.
You've written 3 specific dataset or training changes you'd make next.
You've checked for overfitting in
results.png.
We've validated. Next: how to resume training, fine-tune from your best.pt, and iterate.